Definition: A trend can be defined
as the general direction of a market or of the price of an asset. Technical analysis is built on the assumption that
prices trend. Trend Lines are an important tool in technical analysis for both
trend identification and confirmation. A trend line is a straight line that
connects two or more price points and then extends into the future to act as a
line of support or resistance. Many of the principles applicable to support and
resistance levels can be applied to trend lines as well. As a general strategy,
it is to best to trade with trends, meaning that if the general trend of the
market is headed up, you should be very cautious about taking any positions
that rely on the trend going in the opposite direction.
Types of Trends: In technical analysis,
it is the movement of the highs and lows that constitutes a trend. Basically
trend can be defined in two ways one is uptrend and downtrend, and sideways trend
are also include in trend.
Uptrend-Line: An uptrend is
classified as a series of higher highs and higher lows and an uptrend line has a positive slope and
is formed by connecting two or more low points. The second low must be higher than the first for the line to
have a positive slope. Uptrend lines act as support and indicate that
net-demand is increasing even as the price rises. A rising price combined with
increasing demand is very bullish, and shows a strong determination on the part
of the buyers. As long as prices remain above the trend line, the uptrend is
considered solid and intact.
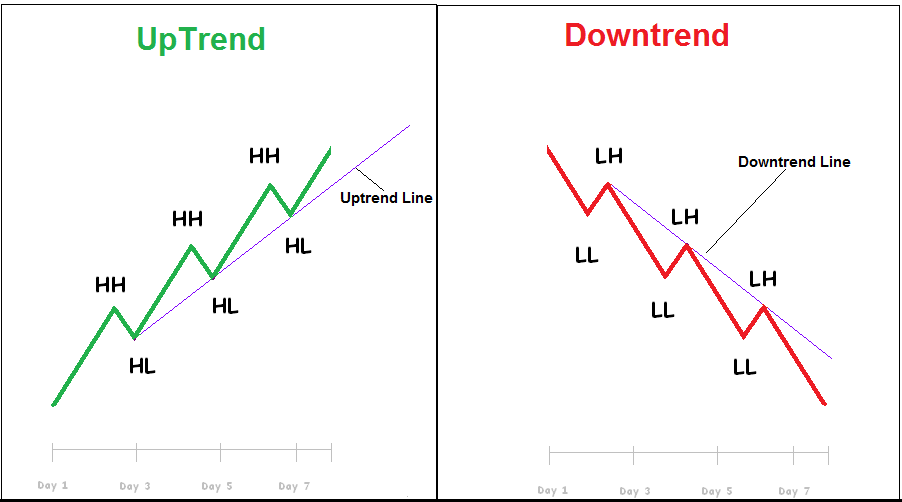
Downtrend-Line: A downtrend is classified as a series
of lower lows and lower highs. It describes the price movement of a financial asset
when the overall direction is downtrend. A downtrend line has a negative slope
and is formed by connecting two or more high points. The second high
must be lower than the first for the line to have a negative slope. Downtrend
lines act as resistance, and indicate that net-supply is increasing even as the
price declines. A declining price combined with increasing supply is very
bearish, and shows the strong resolve of the sellers. As long as prices remain
below the downtrend line, the downtrend is solid and intact.


Sideways Trend: Sideways trend also
know as horizontal trend or consolidation, describe the horizontal price
movement that occurs when the forces of supply and demand are nearly equal. A
sideways trend is often regarded as a period of consolidation before in the
price continues in the direction of the previous move. It is classified as a series
of horizontal peaks and horizontal troughs. You can heard about a word call
range bound, this phase where market moving or trading in range.
Note: More about trend lines will be on next post please like, if it's useful to you,Thank you.
Comments
Post a Comment